Pages
Interactive dashboards and data views powered by your own server, with AI agent assistance built in.
Pages
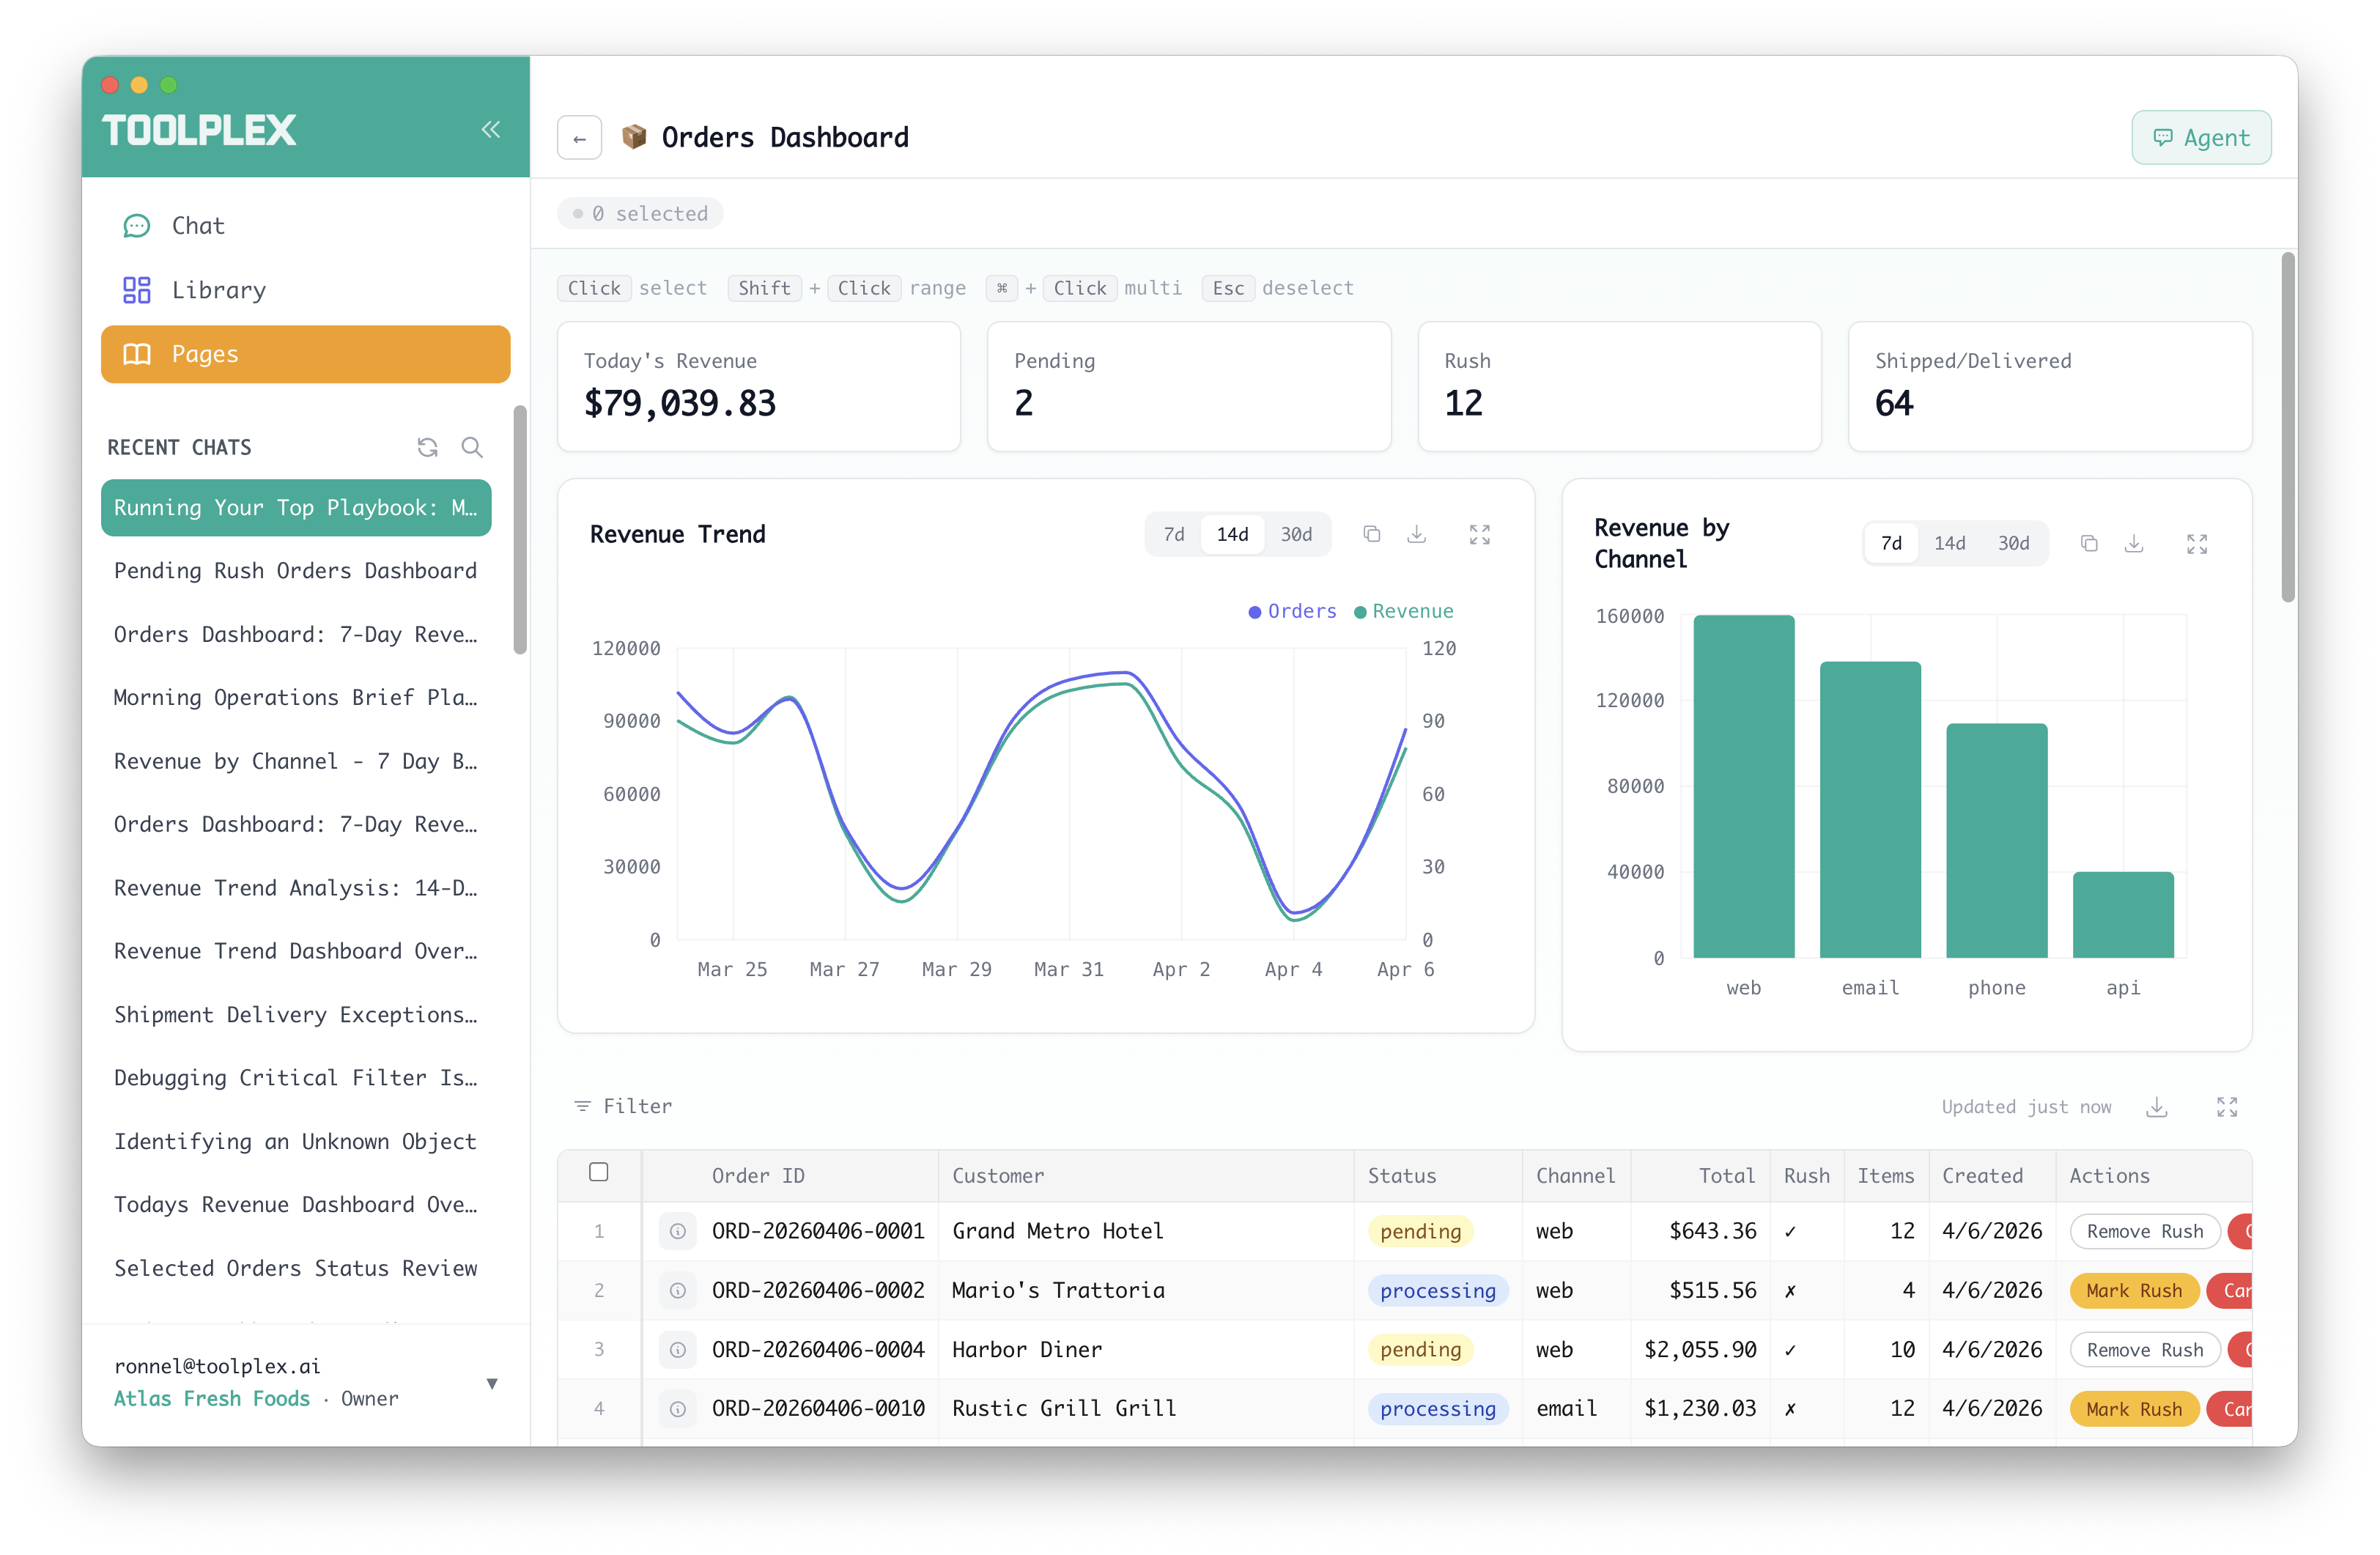
Pages are interactive dashboards that connect ToolPlex to your own data. Define tables, charts, KPI cards, and actions on your server — ToolPlex renders them as a polished UI with built-in filtering, sorting, selection, CSV export, and an AI agent sidebar.
How it works
Pages are served by your own app server using the @toolplex/app-server npm package. Your server defines page layouts, data handlers, and actions. ToolPlex connects to your server, proxies the data, and renders the UI.
Your data never leaves your infrastructure except through the authenticated proxy. ToolPlex renders it — your server owns it. The connection is IP-firewalled and token-authenticated, with user auth, org isolation, and role-based page visibility enforced at the proxy layer.
Setting up your app server
1. Install the package
npm install @toolplex/app-server fastify2. Define pages and resources
import Fastify from "fastify";
import { registerAppPages } from "@toolplex/app-server";

const server = Fastify({ logger: true });

await server.register(registerAppPages, {
  authToken: process.env.APP_TOKEN,

  pages: {
    orders: {
      title: "Orders Dashboard",
      sections: [
        { type: "card-row", source: "order_kpis" },
        {
          type: "table",
          source: "order_list",
          rowKey: "id",
          downloadable: true,
          actions: [
            { label: "Cancel", action: "cancel_order", variant: "danger" },
          ],
          columns: [
            { key: "id", label: "Order ID" },
            { key: "customer", label: "Customer" },
            { key: "total", label: "Total", format: "currency" },
            { key: "status", label: "Status", format: { type: "status", colors: { pending: "yellow", shipped: "green" } } },
          ],
        },
      ],
    },
  },

  resources: {
    order_list: {
      fetch: async ({ page, pageSize, sort, filters }) => {
        // Query your database here
        const rows = await db.query("SELECT * FROM orders ...");
        return { rows, total: rows.length };
      },
    },
    order_kpis: {
      fetch: async () => ({
        rows: [
          { label: "Revenue", value: 125000, format: "currency" },
          { label: "Pending", value: 12, format: "integer" },
        ],
        total: 2,
      }),
    },
  },

  actions: {
    cancel_order: async ({ ids, params }) => {
      await db.query("UPDATE orders SET status = 'cancelled' WHERE id = ANY($1)", [ids]);
      return { affected: ids.length, message: `${ids.length} order(s) cancelled.` };
    },
  },
});

await server.listen({ port: 3100, host: "0.0.0.0" });
3. Connect to ToolPlex
In Org Settings > Pages, configure:
- Enable the Pages toggle
- Set the Server URL Variable and Auth Token Variable (environment variables stored in Vault)
- Test the connection — ToolPlex will discover your pages automatically
Section types
Tables
The primary section type. Supports column formatting, sorting, pagination, column filters, inline actions, row selection, detail drawers, and CSV download.
{
  type: "table",
  source: "order_list",
  rowKey: "id",
  downloadable: true,
  actions: [
    { label: "Approve", action: "approve", variant: "success" },
  ],
  columns: [
    { key: "id", label: "ID" },
    { key: "total", label: "Total", format: "currency" },
    { key: "status", label: "Status", format: { type: "status", colors: { pending: "yellow", done: "green" } } },
  ],
  detail: { source: "order_detail" },
}
Column formats: text, integer, number, percent, currency, date, boolean, or rich formats like status (colored badges), delta (signed change), progress (bar), link, image.
KPI Cards
Summary metrics displayed as a horizontal row of cards.
{ type: "card-row", source: "order_kpis" }The resource returns rows shaped as { label, value, format }.
Charts
Line charts, bar charts, and pie charts with optional timeframe controls.
{
  type: "chart",
  source: "revenue_trend",
  chart: "line",
  title: "Revenue Trend",
  controls: [
    { key: "range", options: ["7d", "14d", "30d"], default: "7d" },
  ],
  x: { key: "date" },
  y: [
    { key: "revenue", label: "Revenue" },
    { key: "orders", label: "Orders", color: "#6366F1", axis: "right" },
  ],
}
Charts support dual Y-axes, copy/download as CSV or PNG, and expand to full screen.
Layouts
Sections can be arranged in a 12-column grid by wrapping them in arrays with span:
sections: [
  { type: "card-row", source: "kpis" },
  [
    { type: "chart", source: "trend", span: 7, ... },
    { type: "chart", source: "breakdown", span: 5, ... },
  ],
  { type: "table", source: "data", ... },
]
Actions
Actions are buttons that trigger server-side operations. They appear inline on table rows and in the toolbar when rows are selected.
{
  label: "Transfer Stock",
  action: "transfer_stock",
  variant: "primary",
  toolbar_only: true,
  inputs: [
    { key: "to_warehouse", label: "To Warehouse", type: "select", options: ["WH-01", "WH-02"] },
    { key: "quantity", label: "Quantity", type: "number", default: 50 },
  ],
  condition: { key: "status", neq: "shipped" },
}variant:default,primary,success,danger,warninginputs: Dynamic form fields collected in a confirmation modal before executioncondition: Show/hide the action based on row values (e.g., only show "Cancel" on non-cancelled rows)bulk: Set tofalseto hide from toolbar (single-row only)toolbar_only: Set totrueto hide from inline buttonscontext: Optional resource fetched when the modal opens, rendered as additional context for the user
Every action opens a confirmation modal showing affected rows, optional inputs, and a confirm/cancel footer. No window.confirm() — a proper UI.
Page-level actions (on PageDefinition.actions) operate on the page entity itself, not rows. They appear in the page header.
Agent sidebar
Every page has an AI agent sidebar that can query the page's data, filter results, and answer questions about what's on screen.
- Selection-aware: Select rows or charts, then ask the agent about them
- View-aware: The agent sees the current sort, filters, and chart timeframe
- Cmd+K: Quick shortcut to open the agent with selected context
The agent has read-only access — it cannot execute actions. Users trigger actions through the UI.
CSV download
Tables with downloadable: true get a download button. Clicking it streams the full filtered dataset as CSV directly from the server — no size limit on the client, with a 1M row safety cap on the server.
Access control
Pages are gated by two org-level controls:
Pages enabled
A global toggle in Org Settings > Pages. When off, no one in the org sees Pages. Default: off.
Per-role page visibility
In Team > Roles & Permissions > AI Settings, admins can configure which pages each role can see:
- All pages (default): The role sees every page the server provides
- Specific pages: Only the selected pages are visible
- No pages: The role cannot see Pages at all
Visibility is enforced server-side — the API filters the page list and blocks access to restricted page definitions.
Data flow
All data flows through ToolPlex's proxy:
- Your app server is IP-firewalled to only accept connections from ToolPlex
- ToolPlex authenticates with a bearer token stored in Vault
- User requests are authenticated, org-isolated, and RBAC-filtered
- Data is streamed through — ToolPlex renders it, your server owns it
No data is stored by ToolPlex. Pages are stateless — every view is a live query to your server.